


.webp)


ProteoVision™: Visualizing proteomics data with ease
Effortlessly transform complex proteomics data into clear, insightful & standardized visualizations – fast, free, and easy to use!

The challenge:
Mass spectrometry (MS)-based proteomics goes beyond raw data acquisition – processing and visualization are crucial for meaningful insights. However, these steps can be complex, time-consuming, and challenging for many researchers.

The solution:
ProteoVision™, a prototype* software, streamlines proteomics data analysis with just a few clicks. It provides comprehensive visualizations of data breadth, depth, completeness, overlap, reproducibility, and more – quick, easy, and completely free.
*please see license agreement for details
New release 0.2.0: With new PowerPoint summary!
Apply! Simple, streamlined workflows

1. Sample
Samples should be liquid, homogenates or a soft pellet.

2. Lyse, reduce, alkylate
Add LYSE reagent, and incubate for 10 mins at 95°C.

3. Digest
Cool, add DIGEST reagent, and incubate for 60 mins at 37°C.

4. Purify
Load onto cartridge, WASH and ELUTE. Dry and resuspend in LOAD.

5. MS measurement
Inject and analyze to see improved peptide identities.

6. Data analysis
Analyze your MS data with ProteoVision™
Results
Data visualization simplified
ProteoVision™ is an intuitive software tool designed to process and visualize proteomics data using standardized workflows. Supporting a wide range of search engines, it effortlessly converts search results into clear, informative plots. These include protein and peptide identifications, detection completeness, sample overlap and reproducibility, and LC-MS quality metrics.
Optimized for plasma proteomics, ProteoVision™ also automates plasma-specific analysis by detecting potential contaminations and assessing proteome coverage. Leveraging data from the Human Protein Atlas, it accelerates and simplifies interpretation – making data analysis faster and more accessible.
PreOmics®'
ProteoVision™
values

Smile
- Visualize your proteomics data effortlessly – fast, clear, and free
- Intuitive tool for complex data
- Quick insight into depth, overlap & reproducibility
- Plasma-specific QC: contamination & protein levels
- Works with DIA-NN, Spectronaut®, MaxQuant® & more
- 100% free to use

Relax
- Skip the hassle – ProteoVision™ does the heavy lifting
- No coding, no format conversion
- Auto-merges multiple search outputs
- Compatible with *.txt, *.tsv and *.parquet formats
- Plots ready for publication in minutes
- DIA-focused, flexibly adaptable
Realize
- Unlock deeper insights and boost your workflow quality
- Standardized data evaluation
- Fast LC-MS troubleshooting
- Plasma QC metrics built-in
- Supports CQE with expected fold change
- Ready for ENRICH technology for smoother plasma analysis
PepSep® Columns & Emitters
ProteoVision™
Request quote
Instrument
Instrument
Effortlessly transform complex proteomics data into clear, insightful & standardized visualizations – fast, free, and easy to use!
ProteoVision™
Request quote
Instrument
Instrument
Effortlessly transform complex proteomics data into clear, insightful & standardized visualizations – fast, free, and easy to use!
ProteoVision™
Request quote
Instrument
Instrument
Effortlessly transform complex proteomics data into clear, insightful & standardized visualizations – fast, free, and easy to use!
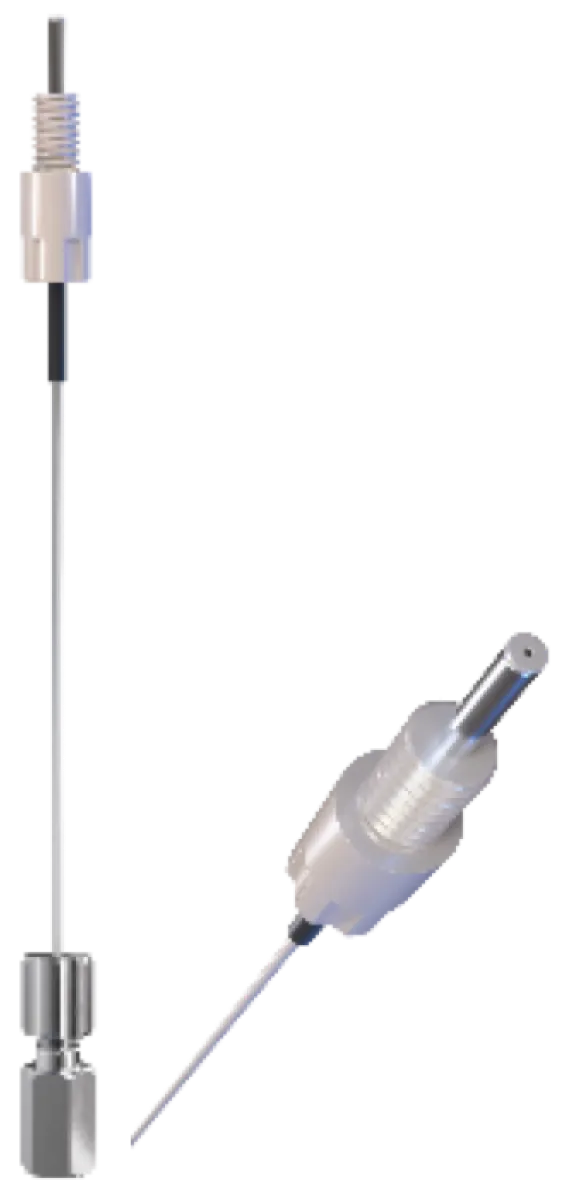
PepSep® Classics* – Performance Meets Simplicity
Versatile columns for standard and advanced proteomics workflows.
- 50 cm × 75 µm × 1.5 µm → Spectral Library Generation | Art.-Nr. 1895846
- 25 cm × 75 µm × 1.5 µm → Sensitivity | Art.-Nr. 1893484
- 25 cm × 150 µm × 1.5 µm → Versatility | Art.-Nr. 1893476
- 15 cm × 150 µm × 1.5 µm → Throughput | Art.-Nr. 1893474
- 8 cm × 150 µm × 1.5 µm → Speed | Art.-Nr. 1893470
* additional column dimensions available. The full list of dimensions can be found in the brochure
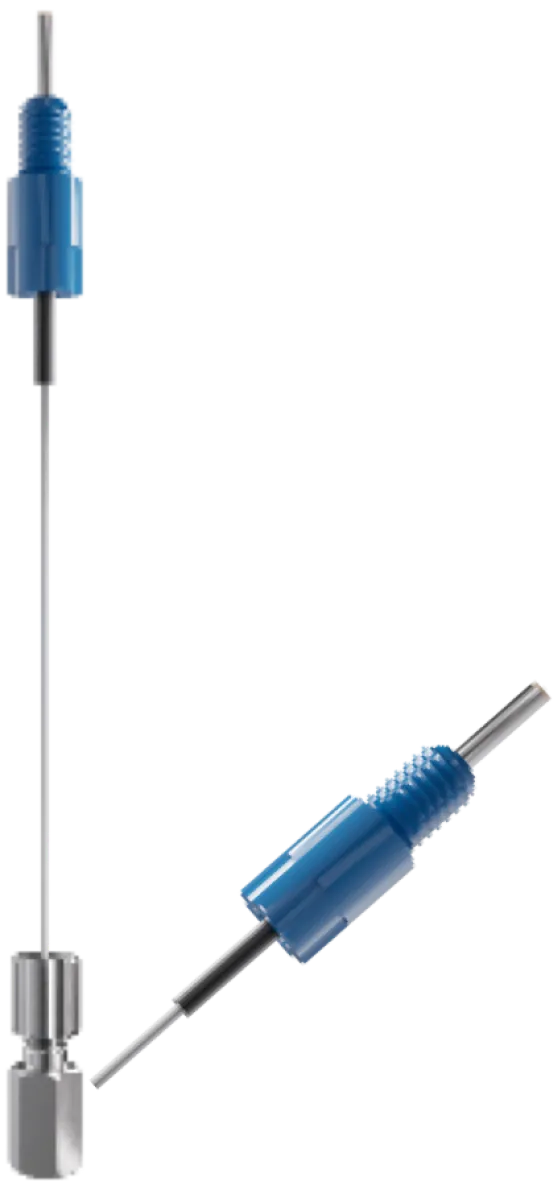
PepSep® Advanced – Next Level Sensitivity
For the highest performance and maximum peptide coverage.
- 25 cm × 75 µm × 1.5 µm → New gold standard | Art.-Nr. 1919826
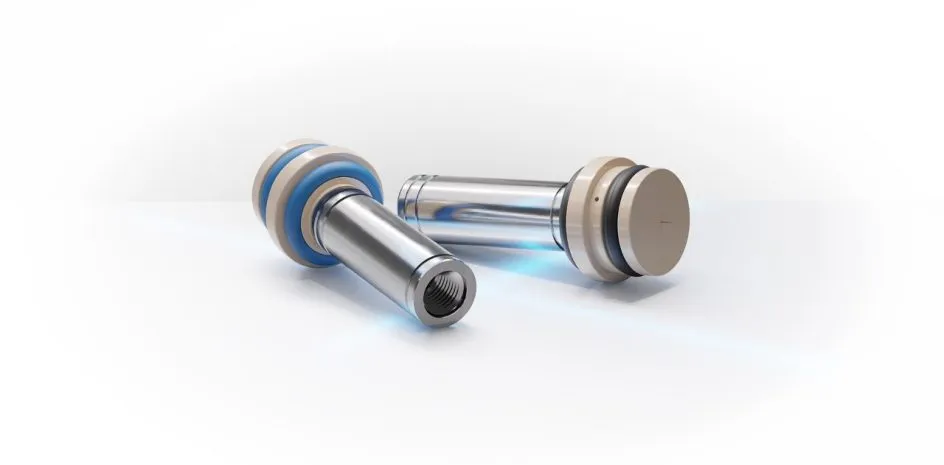
CaptiveSpray 2 Emitters
Plug-and-play emitters for hassle-free CaptiveSpray setup. Two variants, separate from columns for easy replacement and longer LC-MS system life with peak performance (Pack of 2 pieces).
- 10 µm | Art.-Nr. 1811112
- 20 µm | Art.-Nr. 1811107
The PreOmics® products displayed are for visual representation only and may differ from those received
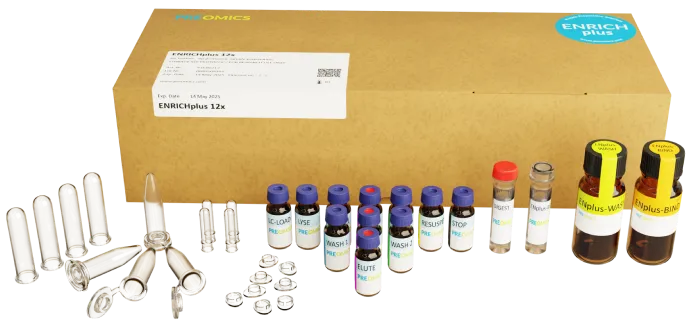
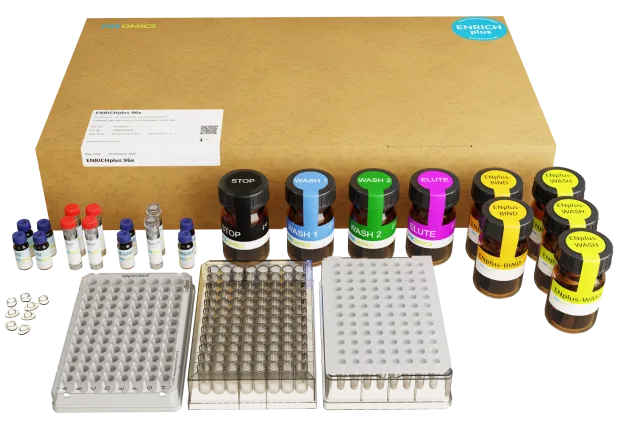
ENRICHplus
ProteoVision™
Request quote
Instrument
Instrument
Effortlessly transform complex proteomics data into clear, insightful & standardized visualizations – fast, free, and easy to use!
ProteoVision™
Request quote
Instrument
Instrument
Effortlessly transform complex proteomics data into clear, insightful & standardized visualizations – fast, free, and easy to use!
ProteoVision™
Request quote
Instrument
Instrument
Effortlessly transform complex proteomics data into clear, insightful & standardized visualizations – fast, free, and easy to use!
The PreOmics® products displayed are for visual representation only and may differ from those received
ProteoVision™
ProteoVision™
Request quote
Instrument
Instrument
Effortlessly transform complex proteomics data into clear, insightful & standardized visualizations – fast, free, and easy to use!
ProteoVision™
Request quote
Instrument
Instrument
Instrument
Effortlessly transform complex proteomics data into clear, insightful & standardized visualizations – fast, free, and easy to use!
ProteoVision™
Request quote
Instrument
Instrument
Effortlessly transform complex proteomics data into clear, insightful & standardized visualizations – fast, free, and easy to use!
Request quote
No items found.
The PreOmics® products displayed are for visual representation only and may differ from those received


We currently don't have resource for this, but feel free to check the other tabs
We currently don't have resource for this, but feel free to check the other tabs
We currently don't have resource for this, but feel free to check the other tabs
We currently don't have resource for this, but feel free to check the other tabs
We currently don't have resource for this, but feel free to check the other tabs


