


.png)
en


The challenge:
Preparing samples with complex proteomes e.g. human cell lines or tissues, or samples with a wide dynamic range in protein abundances for in depth proteomic characterizations is a compromise between effort, cost and method complexity.

The solution:
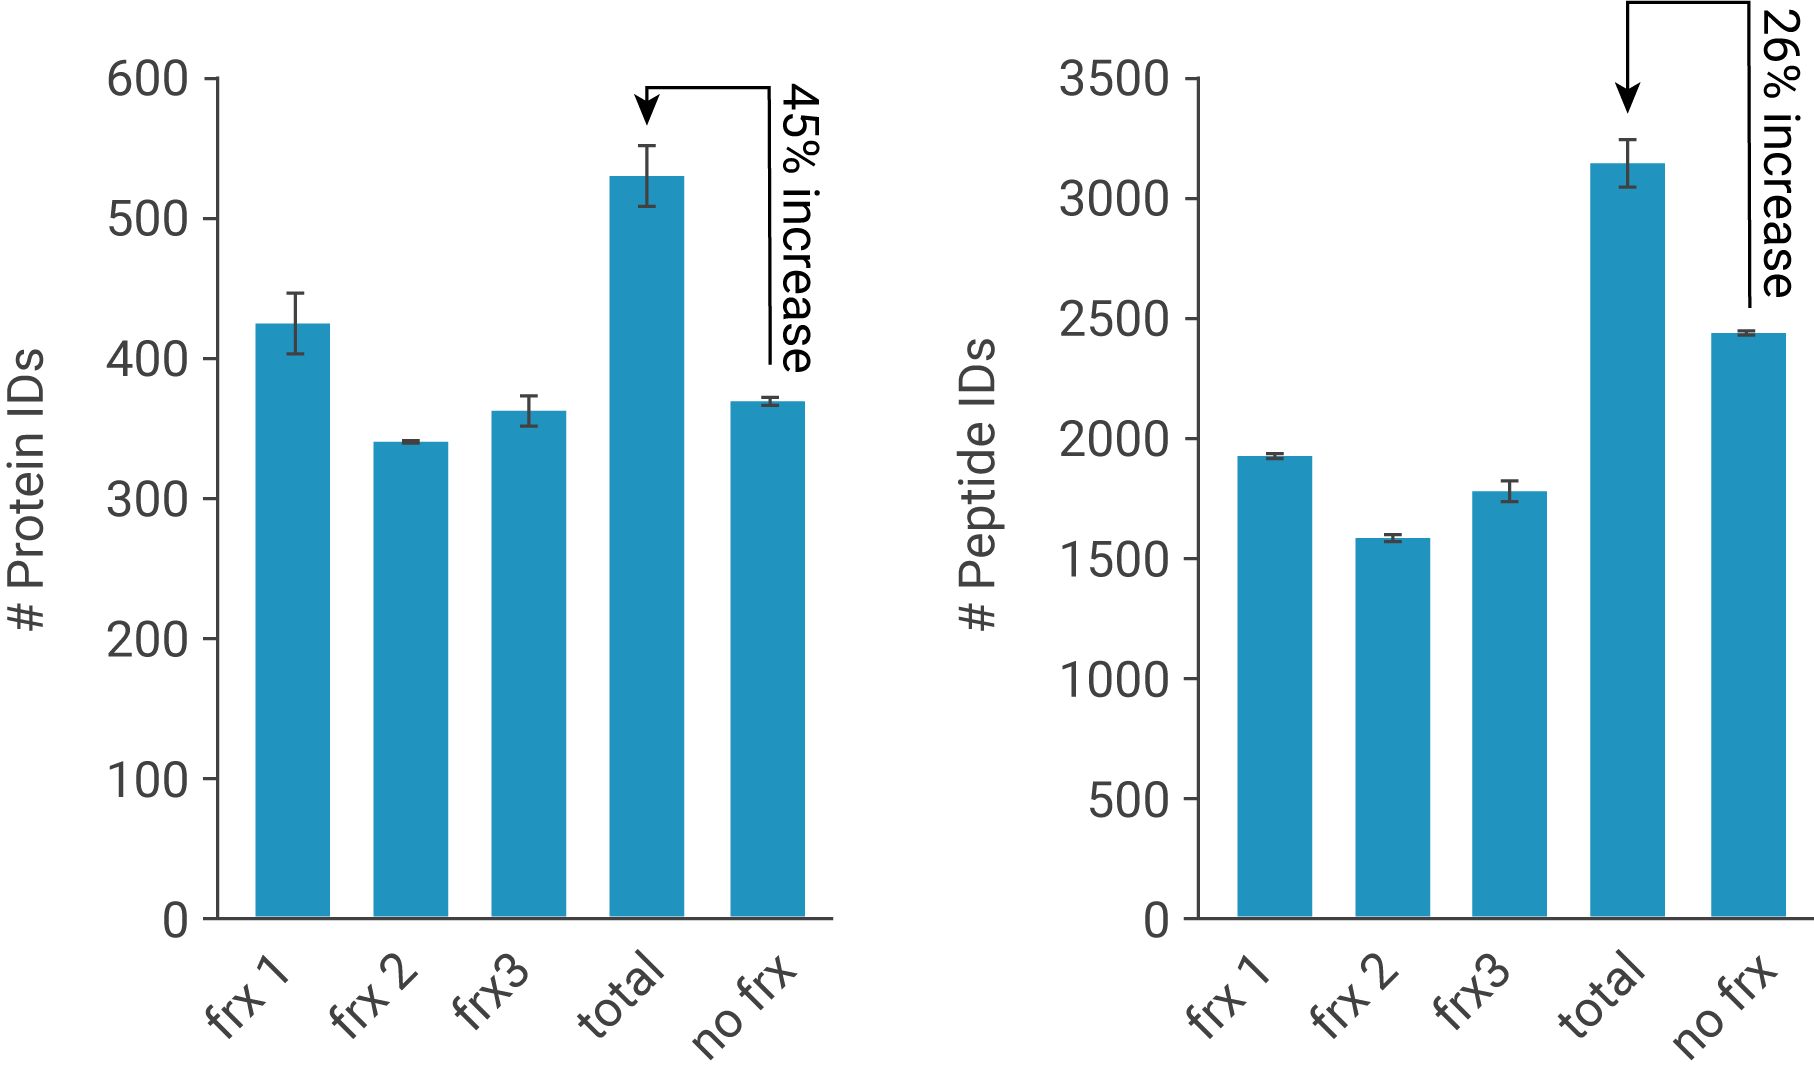
The PreOmics® iST-Fractionation Add-on is based on dipole-moment and mixed-phase interactions (patent pending). Samples are prepared using the PreOmics® iST kits until the WASH step and then fractionated using PreOmics® iST-Fractionation Add-on kit. The fractionation buffers are prepared ready for use and the method takes just 10 minutes. The resulting fractions provide a significant increase in the peptide and protein identifications from a single sample.
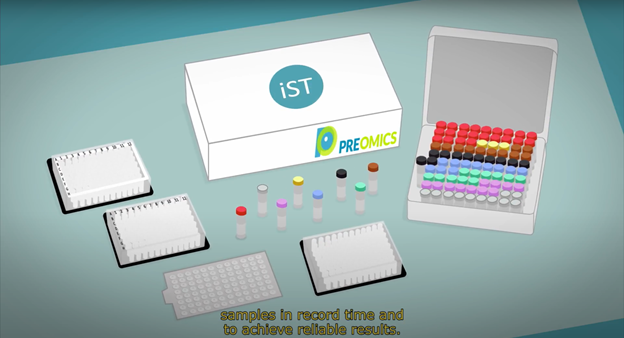
Apply! Simple, streamlined workflows
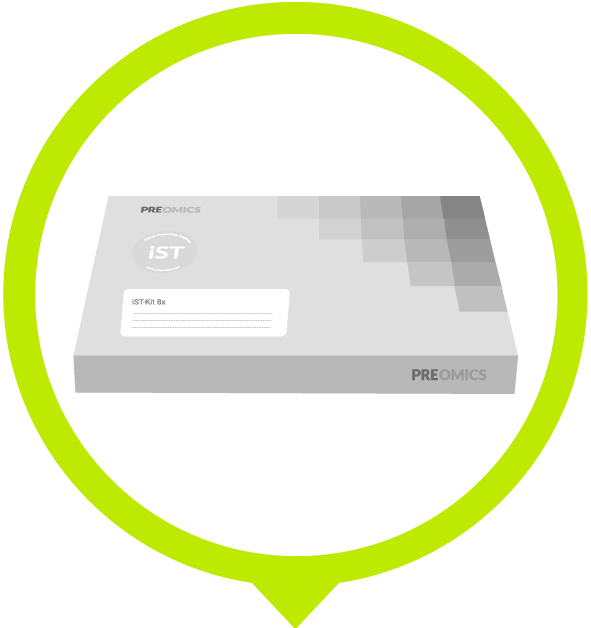
1. Samples
Follow iST or iST-NHS protocol until WASH steps.

2. Fraction-1
Swap to a collection container. Add FRACTION-1 to the cartridge and spin.
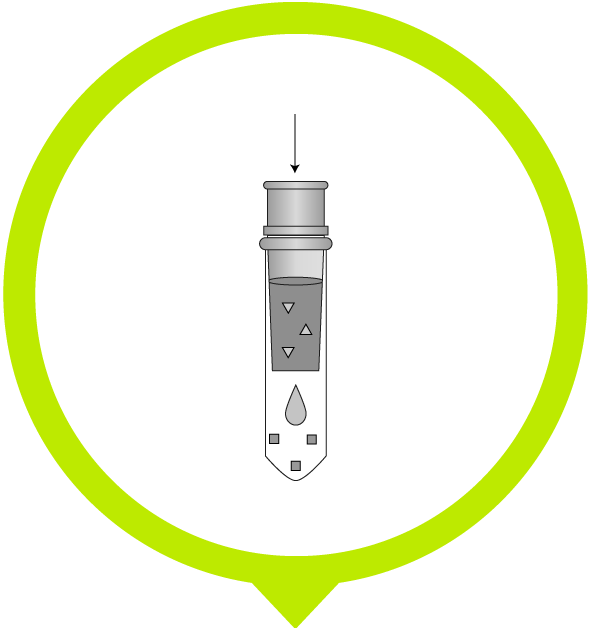
3. Fraction-2
Change to a new collection container. Add FRACTION-2 to the cartridge and spin.

4. Fraction-3
Change to a new collection container. Add FRACTION-3 to the cartridge and spin.

5. MS analysis
Dry the samples and resuspend them in LC-LOAD. Inject and analyze to see improved peptide and protein identifications.
Results

PreOmics®'
iST-Fractionation Add-on
values

Smile
Improved sample quality
- Achieve proficient peptide fractionation easily
- Working range: 1-100 µg
- Typically 40-50% more protein identifications compared to an unfractionated sample*
* Depending on sample type and MS instrumentation

Relax
Quicker methodology
- 10 min hands-on time
- All-in-one solution, all buffers and consumables provided
- Compatible with standard lab equipment
- Shipped at RT🌿
Realize
Increased peptide and protein identifications
- Achieve ready-to-measure fractionated peptides
- Sensible compromise between processing time and proteomic depth
- Suitable for a range of processing options
iST-Fractionation Add-on
iST-Fractionation Add-on
Request quote
Instrument
Instrument
Simple, fast and reproducible peptide fractionation giving increased proteomic depth
iST-Fractionation Add-on
Request quote
Instrument
Instrument
Simple, fast and reproducible peptide fractionation giving increased proteomic depth
Request quote

8x3 reactions iST-Fractionation Add-on
P.O.00100
8-sample kit
$91
78 €

12x3 reactions iST-Fractionation Add-on
P.O.00101
12-sample kit
$136
118 €
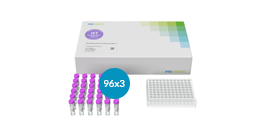
96x3 reactions iST-Fractionation Add-on
P.O.00102
96-sample kit
$639
521 €
The PreOmics® products displayed are for visual representation only and may differ from those received
Resources


Imagine
Applying the science
Find out more about the wide range of applications to which PreOmics technology has been successfully applied


